
Because the GUI may not always be available on Linux, there are commands for almost everything. When working on servers, only shell access is accessible, so everything must be done through those commands. So today we’ll look at several tools that may be used to monitor memory usage on a Linux system. Swap and RAM are included in the memory.
Checking the amount of memory utilised and the amount of memory used per process on servers is also necessary to ensure that resources are not depleted and that users have access to the server. Consider a website. If you’re running a Webserver, you’ll need enough memory to service the site’s visitors. If not, when there is a traffic spike, the site will become very slow, if not completely unavailable, due to a lack of memory. It’s the same thing that happens on your desktop computer.
1. Free Command
The Free Command is the easiest and simplest command to use for checking memory use on Linux. Here’s just a short example:
$ free -m
             total       used       free     shared    buffers     cached
Mem:          7976       6459       1517          0        865       2248
-/+ buffers/cache:       3344       4631
Swap:         1951          0       1951
The m option displays all data in MBs. The total os 7976 MB is the total amount of RAM installed on the system, that is 8GB. The used column shows the amount of RAM that has been used by Linux, in this case around 6.4 GB. The output is pretty self-explanatory. The catch over here is the cached and buffers column. The second line tells that 4.6 GB is free. This is the free memory in the first line added with the buffers and cached amount of memory.
Linux has the habit of catching lots of things for faster performance, so that memory can be freed and used if needed.
The last line is the swap memory, which in this case is lying entirely free.
2. /proc/meminfo
The next way to check the use of memory is to read the “/proc/meminfo” file. Know that there are no actual files in /proc file system. These are rather virtual files that contain dynamic kernel and system information.
$ cat /proc/meminfo
MemTotal:        8167848 kB
MemFree:         1409696 kB
Buffers:          961452 kB
Cached:          2347236 kB
SwapCached:            0 kB
Active:          3124752 kB
Inactive:        2781308 kB
Active(anon):    2603376 kB
Inactive(anon):   309056 kB
Active(file):     521376 kB
Inactive(file):  2472252 kB
Unevictable:        5864 kB
Mlocked:            5880 kB
SwapTotal:       1998844 kB
SwapFree:        1998844 kB
Dirty:              7180 kB
Writeback:             0 kB
AnonPages:       2603272 kB
Mapped:           788380 kB
Shmem:            311596 kB
Slab:             200468 kB
SReclaimable:     151760 kB
SUnreclaim:        48708 kB
KernelStack:        6488 kB
PageTables:        78592 kB
NFS_Unstable:          0 kB
Bounce:                0 kB
WritebackTmp:          0 kB
CommitLimit:     6082768 kB
Committed_AS:    9397536 kB
VmallocTotal:   34359738367 kB
VmallocUsed:      420204 kB
VmallocChunk:   34359311104 kB
HardwareCorrupted:     0 kB
AnonHugePages:         0 kB
HugePages_Total:       0
HugePages_Free:        0
HugePages_Rsvd:        0
HugePages_Surp:        0
Hugepagesize:       2048 kB
DirectMap4k:       62464 kB
DirectMap2M:     8316928 kB
Check the values of MemTotal, MemFree, Buffers, Cached, SwapTotal, SwapFree.
They indicate the same values of memory usage as the free command.
3. vmstat
The vmstat command with the s option lays out the memory usage statistics much like the proc command. Here is an example:
$ vmstat -s
      8167848 K total memory
      7449376 K used memory
      3423872 K active memory
      3140312 K inactive memory
       718472 K free memory
      1154464 K buffer memory
      2422876 K swap cache
      1998844 K total swap
            0 K used swap
      1998844 K free swap
       392650 non-nice user cpu ticks
         8073 nice user cpu ticks
        83959 system cpu ticks
     10448341 idle cpu ticks
        91904 IO-wait cpu ticks
            0 IRQ cpu ticks
         2189 softirq cpu ticks
            0 stolen cpu ticks
      2042603 pages paged in
      2614057 pages paged out
            0 pages swapped in
            0 pages swapped out
     42301605 interrupts
     94581566 CPU context switches
   1382755972 boot time
         8567 forks
$
The top few lines indicate total memory, free memory etc, and so on.
4. top command
Typically, the top command is used to check the memory and CPU consumption per cycle. But it also records the total use of memory and can be used to track the total usage of RAM. The output header has the requisite information. The sample output here is:
top - 15:20:30 up  6:57,  5 users,  load average: 0.64, 0.44, 0.33
Tasks: 265 total,   1 running, 263 sleeping,   0 stopped,   1 zombie
%Cpu(s):  7.8 us,  2.4 sy,  0.0 ni, 88.9 id,  0.9 wa,  0.0 hi,  0.0 si,  0.0 st
KiB Mem:   8167848 total,  6642360 used,  1525488 free,  1026876 buffers
KiB Swap:  1998844 total,        0 used,  1998844 free,  2138148 cached

  PID USER      PR  NI  VIRT  RES  SHR S  %CPU %MEM    TIME+  COMMAND
 2986 enlighte  20   0  584m  42m  26m S  14.3  0.5   0:44.27 yakuake
 1305 root      20   0  448m  68m  39m S   5.0  0.9   3:33.98 Xorg
 7701 enlighte  20   0  424m  17m  10m S   4.0  0.2   0:00.12 kio_thumbnail
Check the KiB Mem and KiB Swap lines on the header. They indicate total, used, and free amounts of the memory. The buffer and cache information is present here too, like the free command.
5. htop
Similar to the top command, the htop command also shows memory usage along with various other details.
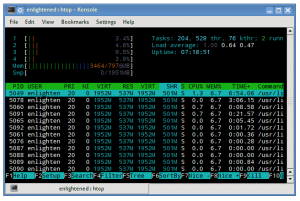
The header on top shows CPU usage along with RAM and swap usage with the corresponding figures.
RAM Information
To find out hardware information about the installed RAM, use the demidecode command. It reports lots of information about the installed RAM memory.
$ sudo dmidecode -t 17
# dmidecode 2.11
SMBIOS 2.4 present.

Handle 0x0015, DMI type 17, 27 bytes
Memory Device
        Array Handle: 0x0014
        Error Information Handle: Not Provided
        Total Width: 64 bits
        Data Width: 64 bits
        Size: 2048 MB
        Form Factor: DIMM
        Set: None
        Locator: J1MY
        Bank Locator: CHAN A DIMM 0
        Type: DDR2
        Type Detail: Synchronous
        Speed: 667 MHz
        Manufacturer: 0xFF00000000000000
        Serial Number: 0xFFFFFFFF
        Asset Tag: Unknown
        Part Number: 0x524D32474235383443412D36344643FFFFFF
Provided information includes the size (2048MB), type (DDR2) , speed(667 Mhz) etc.
Summary
All of the above commands operate from the terminal and have no interface. When dealing with a GUI on a desktop, the use of a graphical display Interface tool is much simpler. Gnome-system-monitor on gnome and keyguard on KDE are the commonest tools. Both provide information about the resource use of CPU, RAM, swap, and network bandwidth in a graphical and easy to understand visual performance.